ZONN.ai Forensic Report
Case · A6EEFE5C · IMAGE
Probably real
More signals lean toward real than AI, but some give weaker readings. Worth a second look on close inspection.
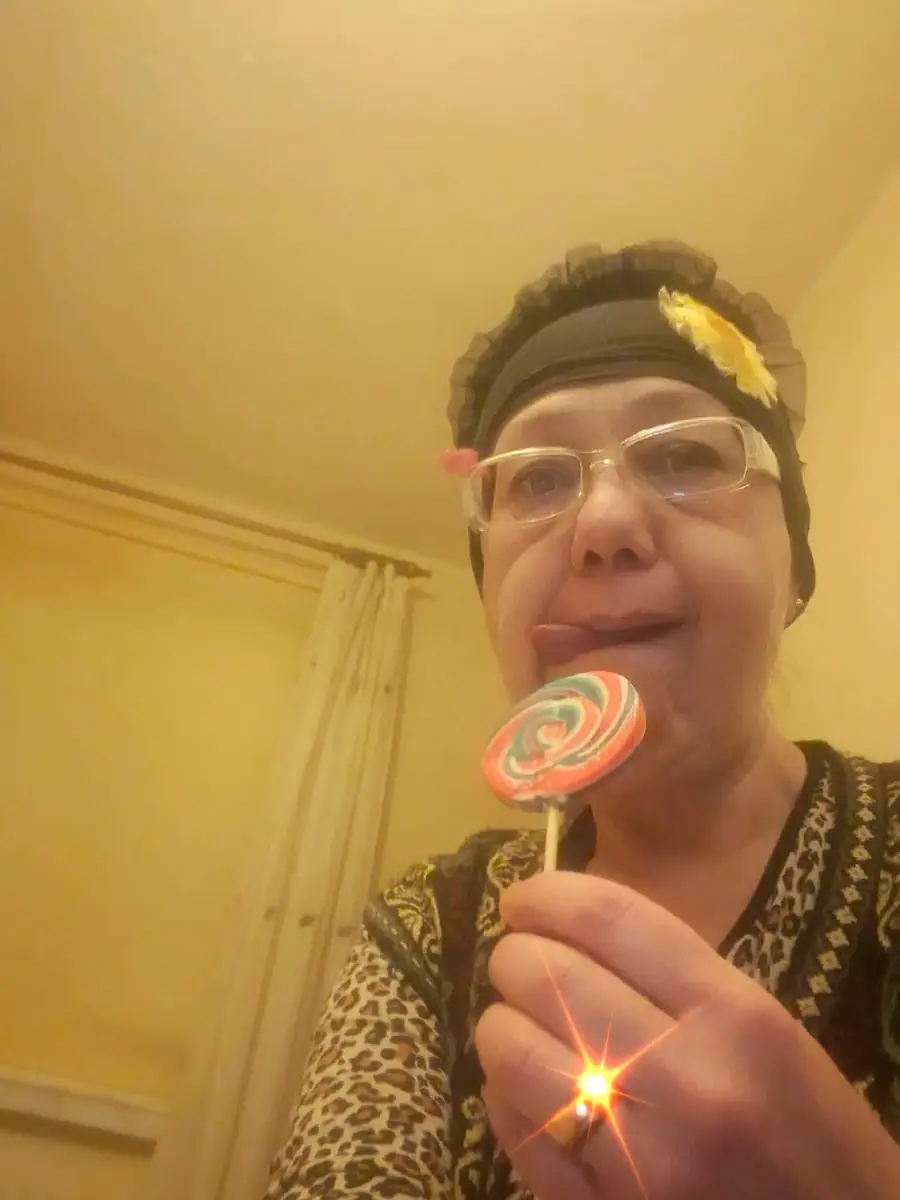
Analysed Specimen
Heads up — 4 things to know
Why this analysis might be off
We highlight every disagreement and unusual signal we found so you can judge for yourself. Stronger warnings come first; informational notes are at the bottom.
Multiple detectors unreachable
Note4 ML detectors did not respond (Ml Python Siglip, Ml Commfor, Itsnotai V2, Xrayon Convnext). The verdict was computed with reduced evidence; reliability is lower than usual.
Heavy JPEG compression
NoteBytes-per-pixel is 0.032 — the image is heavily compressed. ML accuracy drops on heavily re-encoded images; treat the verdict with extra caution.
Upsampling artifacts in the frequency domain
AI evidenceFFT analysis found strong upsampling patterns — a fingerprint of diffusion-model VAE decoders (latent → pixel-space upscale).
Weak overall confidence
NoteAggregate verdict confidence is 26/100. Several detectors returned uncertain answers or were offline. Read the verdict as a guideline, not as a final answer.
Origin Check
Trace this image elsewhere
Cross-reference the source against major reverse-image services. Each link opens in a new tab with the image URL preloaded — ZONN.ai does not re-upload the image.
Why this verdict
- Noise Patternflagged AI · 93/100
Sensor-noise (PRNU) fingerprint check. Real cameras leave camera-unique noise.
- Color Distributionread real · 7/100
Global color distribution shape vs natural-photo baselines.
Model Agreement
Variance across 5 ML detectors. Higher agreement means the models converged on the same reading; lower agreement means treat the verdict with care.
Evidence — 15 detectors reviewed
What each detector saw
Each detector independently gave this imagea score from 0 (definitely real) to 100 (definitely AI). The score above is their weighted consensus — detectors with higher confidence count more. No single detector decides; you read the spread.
ML Models5 detectors · mean 50▸ expand▾ collapse
Pixel & Frequency Forensics7 detectors · mean 51▸ expand▾ collapse
Provenance & Metadata3 detectors · mean 45▸ expand▾ collapse
Image Quality
- Dimensions
- 1536 × 2048 px
- Aspect
- 0.750
- File size
- 97.3 KB
- Bytes / pixel
- 0.032
Frequency Analysis
Edge Consistency
Per-region edge density (4 × 4 grid). Uneven distribution may indicate localized editing or splicing; uniform fields are typical of fully synthetic outputs.
Range: 1.0109 – 9.3130
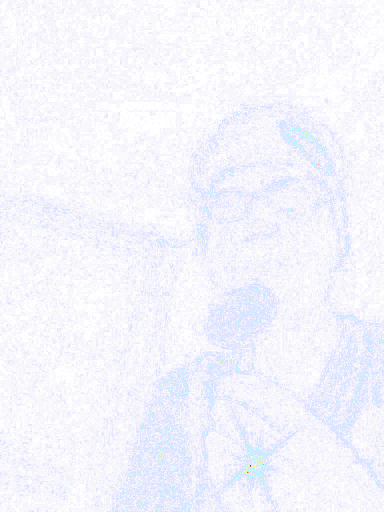
Noise Fingerprint
- Variance
- 13.38
- Std deviation
- 3.66
- Mean
- -0.0
- Spatial corr.
- 0.966
- Mean Δ
- 1.20
- σ
- 1.49
- CV
- 1.242
- Uniformity
- -0.242